QA | CloudShark Threat Assessment
Detect & analyze malware in your network captures
Improve and simplify incidence response and investigation
 Watch video
Cyber-attacks are now bigger, faster, and happening more frequently than ever
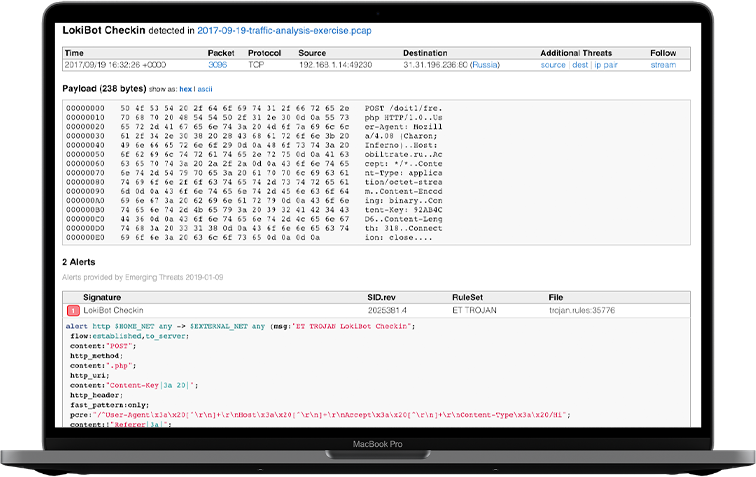
Now, you can go from an IDS alert right to the packets that triggered it.
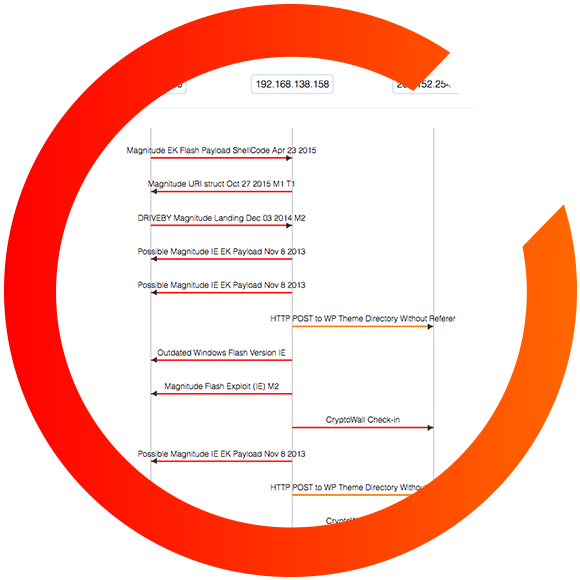
While many tools simply give a high-level overview of attacks or violations, they’re missing out on vital information. CloudShark’s Threat Assessment tool provides the tools you need to quickly determine the root cause of an alert and protect your network. Applying directionality to security alerts, CloudShark Threat Assessment produces threat vectors that show the structure and timeline of a compromise or attack. See beyond the alert name to understand when it happened, where it came from, who was the target, and how and if it propagated.
IDS Alerts are only the beginning of the story - CloudShark Threat Assessment takes you to the packets that triggered them
Compare stream data side-by-side
Go directly to the packets and the stream that caused the problem, making identification and investigation fast and easy.
Find the root cause faster and share your insights
Easily collaborate with colleagues and experts to get to the bottom of an attack or anomaly. Your analysis can be shared with a single URL.
Zoom in on the details
Deciding between a false-positive or legitimate alert can happen in one window where the analyst has raw PCAP bytes accessible within the same environment as the alert. You can quickly jump to a full follow-stream view for that traffic or filter your PCAP by specific port information.
Perfectly integrated with CloudShark
Threat Assessment is built right into CloudShark like all other analysis tools. Once you upload a PCAP file, simply open it and choose Threat Assessment from the Analysis Tools menu. A high-level summary will display in seconds.
“Bring Your Own Rules”
Our BYOR policy means you can bring along your own custom rules and Zeek (bro) scripts that have been developed in house, installed via zkg or purchased from a third party such as ProofPoint. Threat Assessment ships with the default ET open ruleset, but allows full customization of the Suricata environment.
Threat Assessment Statistics
Built on top of the industry standard Suricata IDS software, Threat Assessment provides all the details you need to identify the root cause of a malware attack.
The information you need, when you need it
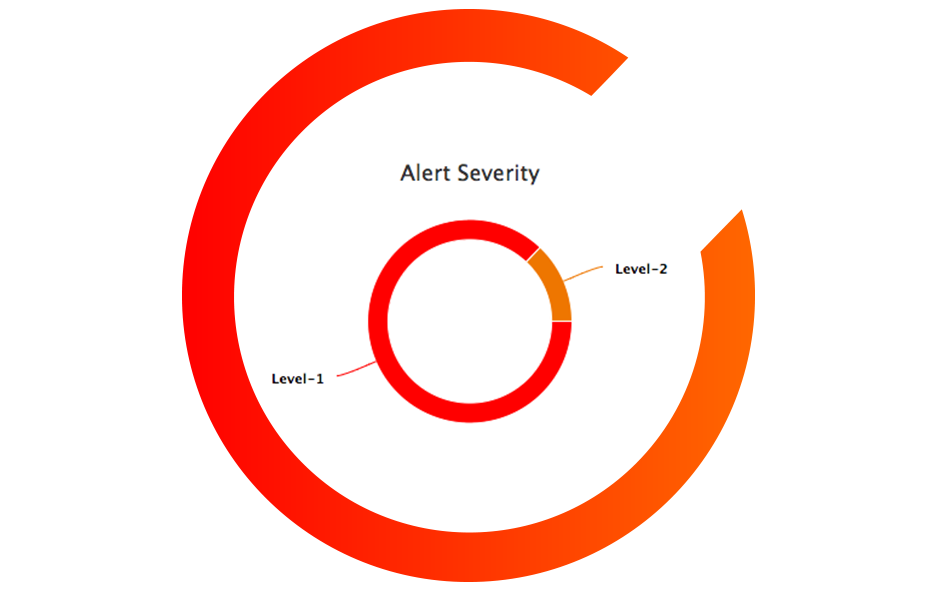
So just how bad is it?
CloudShark tells you how much of a bad thing you have going on, and helps you drill down to exactly the hosts and packets that are involved in each alert.
Who was exposed, and when?
Identify and document Indicators of Compromise from capture files while you are investigating an incident. Malware signatures, binaries, and other assets are all easily identified within CloudShark.
Is it still happening?
With CloudShark managing all your important capture files, you can quickly jump between events and dates to compare traces, making sure that a malware or virus has been cleaned up completely.
Know who is involved in an attack
When there's something strange going on, it helps to see it right up front. See how much malicious activity there is in your capture, and how bad it is at a glance.
Bad actors can come from inside or outside your network. CloudShark breaks it down by both source and destination endpoints; letting you see who is involved so you can take the appropriate action.
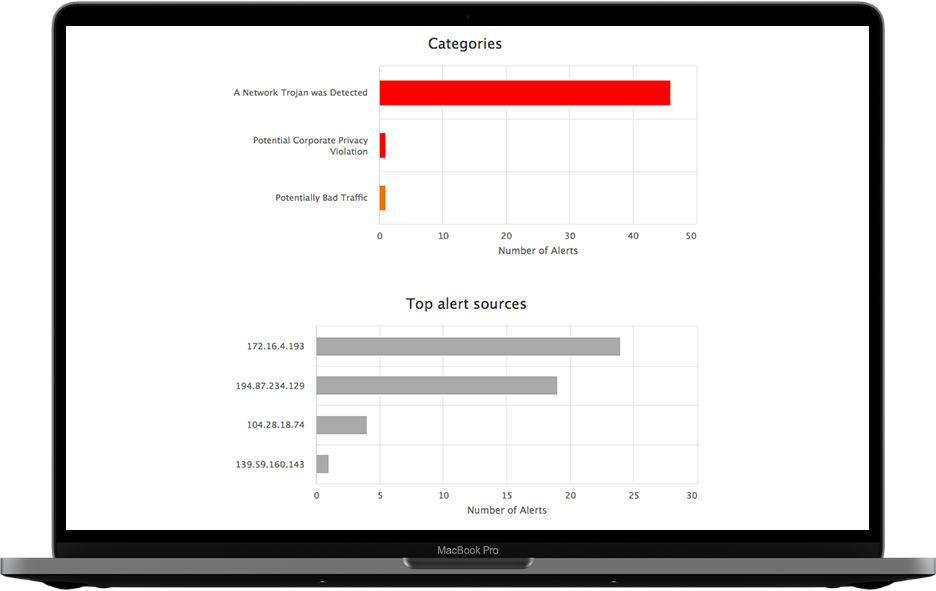
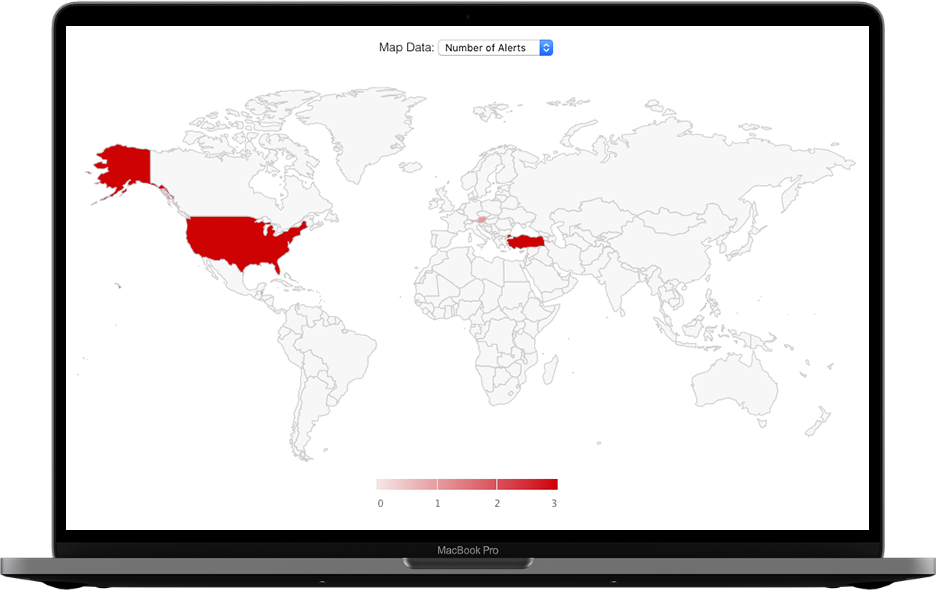
See where attacks are coming from
With built-in GeoIP mapping capabilities, you get a picture of where in the world suspicious traffic is coming from and going to.
Clicking on a country will bring you right to the display filter for those packets. And, like everything else in CloudShark, can be accessed simply by URL.
Connecting the dotsDiscover how CloudShark is helping our customers improve network troubleshooting & investigation
Webinars
Identifying, analyzing, and reporting malware incidents using packet captures
February 03, 2021 · 1 min read
In this video, we explore an actual exercise from malware-traffic-analysis.net to learn how to investigate security monitoring alerts using packet captures, from identification to remediation, and the steps you can take to organize and save your analysis for better reporting and retro-hunting in the future.
Articles
PCAP Collaboration Tips for NetSecOps Teams
July 11, 2022
Here are some tips to make working with captures as a team easier, more fruitful for the people doing the work, and more efficient for your organization as a whole.
Articles
3 Tips for Securing Network Capture Data
October 12, 2022
If you are a CISO or head of a NetSecOps department, you need to consider that network packet captures are both a powerful asset and a source of cyber security risk. However, they significantly improve DFIR work, if they are organized and available for collaboration! Here's 3 tips on how your NetSecOps team can pcaps files securely and effectively.
Webinars
Identifying, analyzing, and reporting malware incidents using packet captures
February 03, 2021 · 1 min readIn this video, we explore an actual exercise from malware-traffic-analysis.net to learn how to investigate security monitoring alerts using packet captures, from identification to remediation, and the steps you can take to organize and save your analysis for better reporting and retro-hunting in the future.
Articles
PCAP Collaboration Tips for NetSecOps Teams
July 11, 2022Here are some tips to make working with captures as a team easier, more fruitful for the people doing the work, and more efficient for your organization as a whole.
Articles
3 Tips for Securing Network Capture Data
October 12, 2022If you are a CISO or head of a NetSecOps department, you need to consider that network packet captures are both a powerful asset and a source of cyber security risk. However, they significantly improve DFIR work, if they are organized and available for collaboration! Here's 3 tips on how your NetSecOps team can pcaps files securely and effectively.

Get the upper hand on malware attacks today
Our team is happy to answer your questions or give you a demo. Click below to tell us a bit about yourself and we will get in touch!
Let's chat