Announcements
CloudShark 3.4 - GeoIP maps, custom protocol preferences, and more
December 11, 2017 • 2 min read
It’s the beginning of Winter here, and that means the devs are hard at work building new features into CloudShark to prevent themselves from freezing. The good news is that this has given us CloudShark 3.4, with the ability to see at a glance where in the world packets or malware traffic is coming from (or going to!), tracking bandwidth at the sub-millisecond level, or tweaking protocol decode preferences to fine-tune your analysis.
Mapping your packets and threats
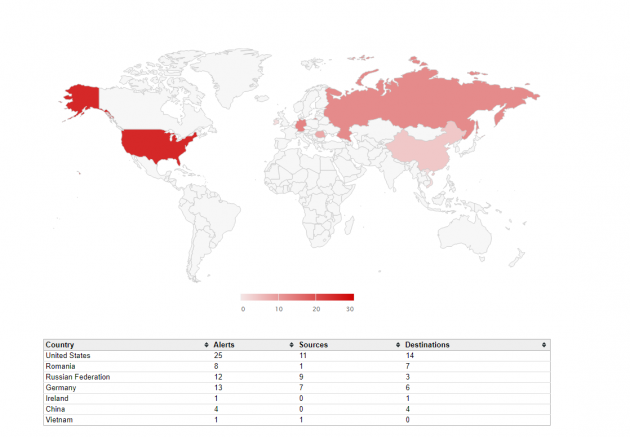
We’re always looking for new ways to visualize packet data in a way that makes packet captures even more useful. This includes our ladder view and of course Threat Vectors, but this time we thought, “what cloud you do if you could instantly see where your capture data comes from or goes to”?

CloudShark has had GeoIP listing for a while, but now in CloudShark 3.4, we apply that data to a global map to show you exactly that. At a glance, you can see if traffic is going to a location that… just doesn’t make sense, and isolate problem areas. Better yet, you can map security alerts from Threat Analysis to show, rather than tell, where malware is coming from.
Analyze protocols in your own context
Since CloudShark works much like Wireshark, our users often ask if they can set custom protocol preferences to make their work even more in-context than before. While this was always possible by setting decode preferences globally on a CloudShark system, we’ve added a handy way to let users set their own preferences specifically for protocol decode preferences per capture.
Improved graph resolution
We’ve also beefed up our CloudShark graphs to be even finer than they were before. This is important for doing analysis on captures that require millisecond-level data points for some deep packet work.
All that and more in CloudShark 3.4! We’re already running it on CloudShark Online, and our active CloudShark Enterprise users can upgrade now.