Articles
How to build a network probe with OpenWrt and CloudShark
5 min read
We’re always geeking out over the multitude of things you can do with packet capture and CloudShark upload support in the popular open source OS for embedded devices, OpenWrt.
In addition to the ability to troubleshoot packet-level detail on home gateways, or monitoring wireless traffic, OpenWrt’s packet capture feature can turn any embedded device to a packet capture node that can instantly upload its data to CloudShark.
Accessing OpenWrt
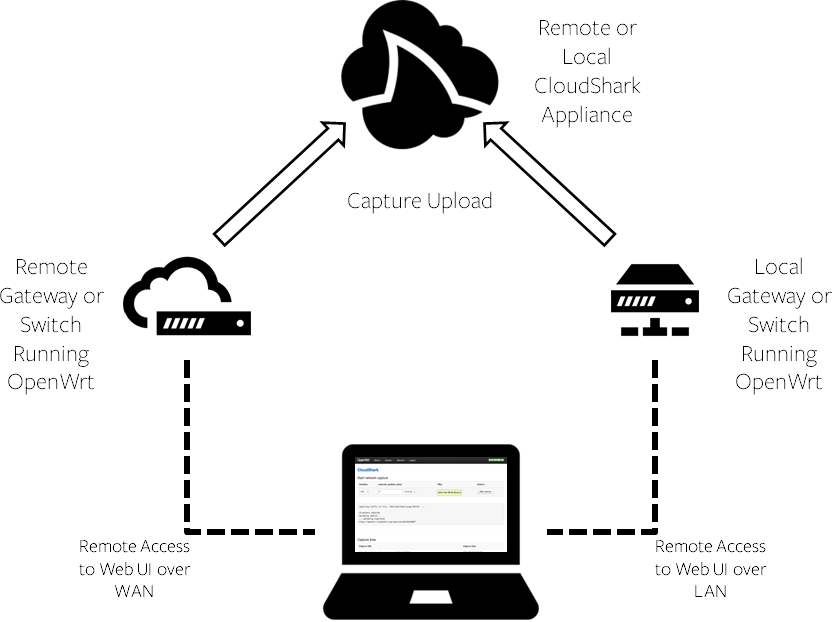
To turn a device into a network probe, you’ll need to be able to access the web user-interface of OpenWrt. This may be a different process depending on if you are attempting to connect to OpenWrt locally or over a WAN connection:

OpenWrt is designed for any kind of embedded device, but is most commonly used for home gateways. As such, the former is certainly easier; connecting to OpenWrt locally effectively treats the device as a network switch. With Wireshark or an external sniffer, you would need to set up a mirror port to effectively sniff traffic, and in OpenWrt this can only be done at the IP layer. However, since OpenWrt has its own packet capture application, you can capture directly on any port.
OpenWrt does not have an automatic “allow WAN access” feature for its remote management application, so accessing your probe remotely is a little more involved if NAT is enabled - you’ll need to set up some specific IP and firewall rules in order to allow this.
Building OpenWrt as a network probe
As we’ve discussed before, you can perform an entire capture through the OpenWrt web UI and automatically upload to CloudShark. However, those use cases revolve around sniffing traffic that is passing through a device operating as a full switch or router; in order to use a device as a probe, you’ll need to configure it in such a way that the port you choose to capture on is receiving the traffic of every interface.
Unfortunately, there aren’t any Ethernet hubs available that support OpenWrt (as far as we can tell), but some OpenWrt supported hardware that allows the configuration of VLANs can work. To do this, you can use the network switch functionality in OpenWrt.
A quick example
Tom from our devops team explains how to do this on a TP-Link1043ndv2 - configuration may be similar for other OpenWrt devices that support an internal switch interface:
Look up the device you are using on the OpenWrt Wiki (http://wiki.openwrt.org/toh/start) and take note of the switch ports for your device, (on ours they were mapped in reverse).
First we need to configure the switch that is inside our OpenWrt router. You will need to remove the two ports to use for sniffing from the default vlan 1. This can be done by editing /etc/config/network and editing this section:
config switch_vlan

    option device 'switch0'
    option vlan '1'
    option ports '0 1 2 3 4'
Delete the two ports to use for capturing from the option ports line. We removed 2 and 3 to use these ports for capturing.
Next we need to pick two new vlan numbers, one for each port, we chose 20 and 30. We need to configure these vlans to be untagged on the physical ports that we want to use to sniff, and tagged with these vlans on the CPU Port (Internal). For our device this was port 0 but this may be different you your device, the OpenWrt Wiki page for your device should have this information. We added the following lines to /etc/config/network to accomplish this:
config switch_vlan
    option device 'switch0'
    option vlan '20'
    option ports '0t 2'
    option vid '20'

config switch_vlan
    option device 'switch0'
    option vlan '30'
    option ports '0t 3'
    option vid '30'
Then we need to configure OpenWrt to create interfaces with these VLANs. Take a look at the /etc/config/network configuration file and find where the lan interface is configured. On our device this was configured here:
config interface 'lan1'
    option ifname 'eth1.1'
    option force_link '1'
    option type 'bridge'
    option proto 'static'
    option ipaddr '192.168.1.1'
    option netmask '255.255.255.0'
    option ip6assign '60'
We can see that on our device the ifname was eth1.1, on other devices this may be eth0.1 or another interface. Configure the vlans you chose as two new interfaces on the same ethX device as ethX.VLAN. For our device we added the following two lines:
config interface 'lan2'
    option ifname 'eth1.20'
    option force_link '1'

config interface 'lan3'
    option ifname 'eth1.30'
    option force_link '1'
Last we will configure a bridge interface named “sniff” that will bridge these two interfaces together and allow us to sniff all the traffic traversing these two ports. Again this can be configured in /etc/config/network:
config interface 'sniff'
    option type 'bridge'
    option proto 'none'
    option ifname 'eth1.20 eth1.30'
    option auto '1'
    option force_link '1'
After all of these changes you should be able to restart networking using the command: /etc/init.d/network restart. You should now have a new interface named br-sniff that you can select using the CloudShark package for OpenWrt that will sniff all of the traffic between two ports! Note that the OpenWrt router still needs a connection to upload captures to openwrt.cloudshark.org or to your own local CloudShark appliance.
You now have a CloudShark enabled network probe!
That’s all there is to it. In order to ensure that there is no wayward traffic coming from OpenWrt itself, be sure to disable features like the DHCP/DNS server and the firewall on the ports you are using to sniff so they don’t affect the network.
Once set up, you can use OpenWrt packet capture and CloudShark to sniff traffic anywhere in your network that you’ve added a probe, and instantly upload that capture to CloudShark, creating a true packet capture network.
Want articles like this delivered right to your inbox?
No spam, just good networking