Articles
Packet Capture in Chrome OS
3 min read
We often get requests from users of Google’s Chrome OS, the operating system installed on the Chromebook series of portable computers, on how to troubleshoot Wifi, apps, or websites. CloudShark is particularly helpful in these cases because installing Wireshark can be difficult or out of the expertise of those using systems like Chrome OS, particularly in education where Chrome OS has become very popular.
Packet capture in Chrome OS
Luckily there are a few ways you can get a network capture in Chrome OS. This post from the Chromebook management team explains how to do so in developer mode:
In Developer Mode you can enter the BASH shell (Ctrl+Alt+T > shell) and type “packet_capture” to start capturing outgoing packets (reference http://www.howtogeek.com/170648/10-commands-included-in-chrome-oss-hidden-crosh-shell/).
The full command is:
packet_capture --device <interface>
Where <interface> is the name of the interface you want to capture on.
Selecting the interface
To get the right interface, you’ll want to use this command:
connectivity show devices
This will give you a lot of output, including a bunch of Wifi information. You can find the interface name at the top of this output, probably mlan0 or wlan0.
Uploading to CloudShark
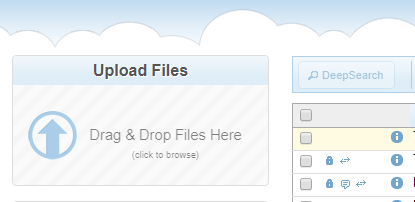
When a capture is complete, it will be saved as a capture file (usually with the .pcap or .pcapng extension). To be able to analyze your capture in CloudShark, you’ll have to upload it. In Chrome OS follow these steps:
- Log-in to your CloudShark online account or your organization’s CloudShark Enterprise system.
- In the capture list view, you’ll find the upload box in the top left.
- Click on it to open the file browse dialog.
- Find the pcap file you’re looking for (in our last example, it’s in the Downloads folder).
- Select the file you want to upload.

And voila! Your capture will be uploaded to CloudShark where you can do your entire analysis right in your Chrome browser - all without having to install any special software.
Troubleshooting Wifi in Chrome OS
If you’re doing Wifi network troubleshooting using Chromebooks, Jim Vajda of framebyframewifi.net has an excellent how-to, including how to take packet captures and send them to CloudShark. Once you follow the instructions under “packet capture”, the capture file will end up in the Downloads folder (thanks to Jim for the shoutout here):
You’ll get a pcap file complete with Radiotap headers if the hardware supports it saved in the Downloads folder which you can send to another machine to do analysis. If the Chromebook is all you have available, you can upload the pcap to CloudShark for analysis.
That’s a few quick tips on how you can deal with network troubleshooting in Chromebook. Here’s some tips for using Airtool for Mac OS X too.
Want articles like this delivered right to your inbox?
No spam, just good networking