Articles
How do you test microburst effects using iPerf?
5 min read
Bursty traffic, particularly microbursts, are an often overlooked phenomenon that can cause serious issues with network performance. We’ve explained before what microbursts are and what they look like, but how can you use existing tools to test your network’s reliability in the presence of microbursts?
How can I test network throughput?
iPerf is one of the most commonly used tools to test network throughput. From their site:
iPerf3 is a tool for active measurements of the maximum achievable bandwidth on IP networks. It supports tuning of various parameters related to timing, buffers and protocols (TCP, UDP, SCTP with IPv4 and IPv6). For each test it reports the bandwidth, loss, and other parameters.
iPerf is used in all kinds of different performance scenarios (even in CloudShark’s sister product, CDRouter, when testing the performance of broadband access devices and Wi-Fi). It requires running an iPerf server on one end of the test network, and an iPerf client to connect and send throughput test traffic (though you can reverse direction with some command line options).
When we first started exploring microbursts, we learned that they are highly dependent on how data is presented to the network interface by the application sending it, and the effects on CPU usage and memory. Knowing we wanted to use iPerf to demonstrate microbursts, we asked: how does iPerf determine how fast to send packets?
How does iPerf decide how fast to send packets?
When configuring iPerf for performance testing, you can select the rate at which you want to send data (depending on the interfaces available). This option is set using the -b flag (or --bitrate). iPerf defines this as:
| -b, --bitrate #[KMG][/#] | target bitrate in bits/sec (0 for unlimited) (default 1 Mbit/sec for UDP, unlimited for TCP) (optional slash and packet count for burst mode) |
Using this flag, for example, you could configure a 100 Mbps link to send data at only 10 Mbps, if you desired. However, that data might be sent within an extremely short time window.
Using the pacing option
To mitigate this, iPerf checks every so often to see how much data it has sent, and compares that to the rate at which it was asked to send the data. If not enough time has elapsed for the amount of data we’ve already sent, it will delay sending more data until the next check. iPerf calls this check ‘pacing’, which is configurable with this option:
--pacing-timer #[KMG]target bitrate in bits/sec (0 for unlimited) (default 1 Mbit/sec for UDP, unlimited for TCP) (optional slash and packet count for burst mode)
This pacing timer is used to determine whether or not iPerf is meeting the long term average bit rate specified with the -b flag. This controls the throttling algorithm.
Experimenting with pacing
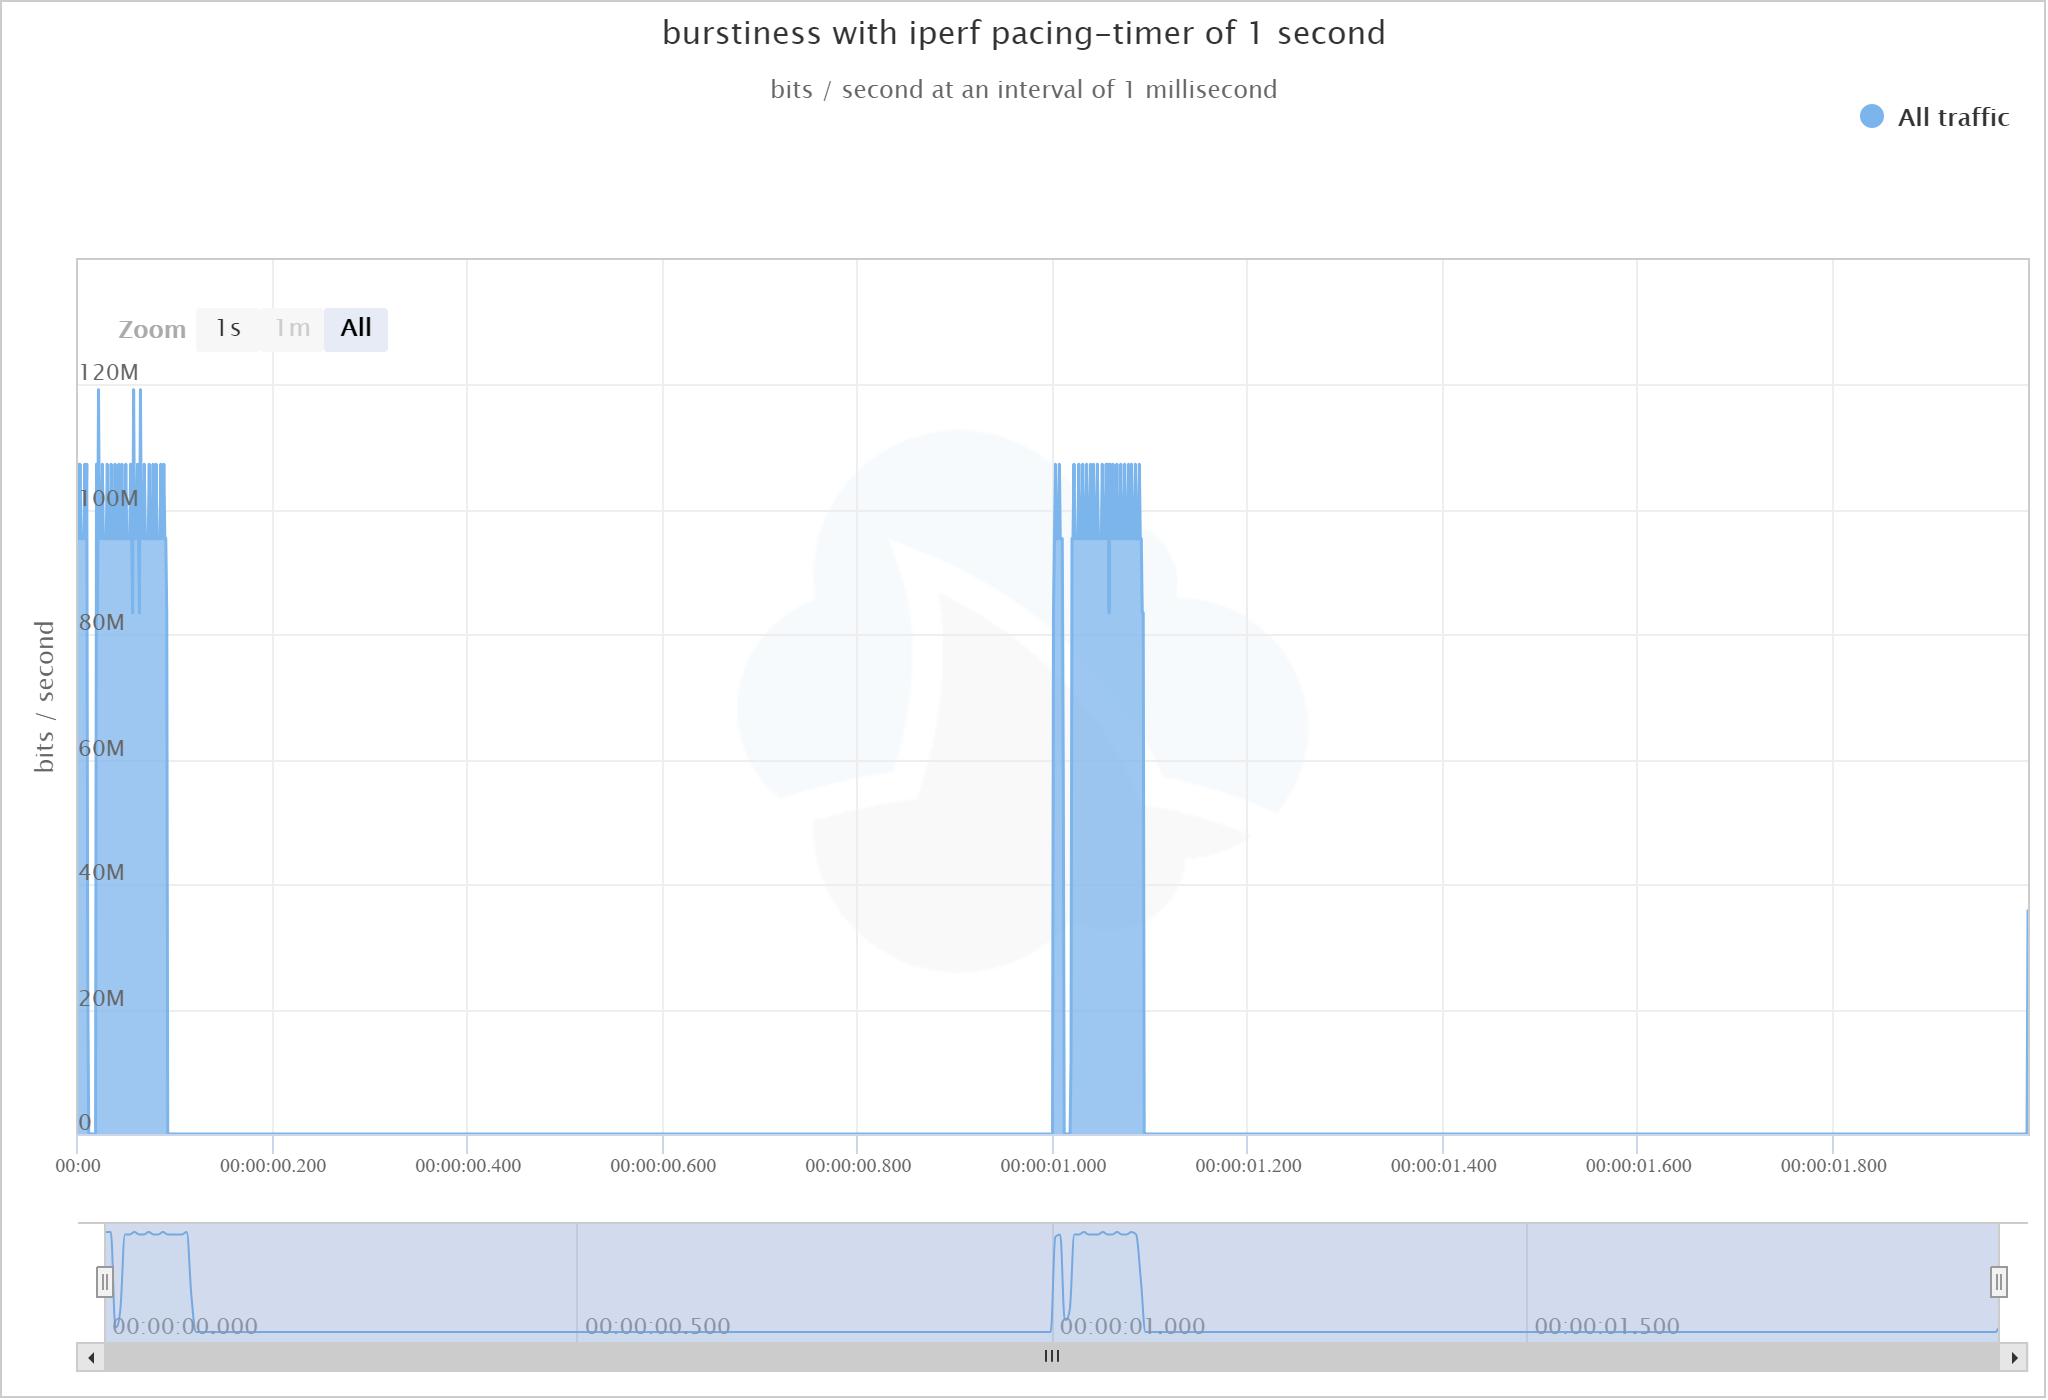
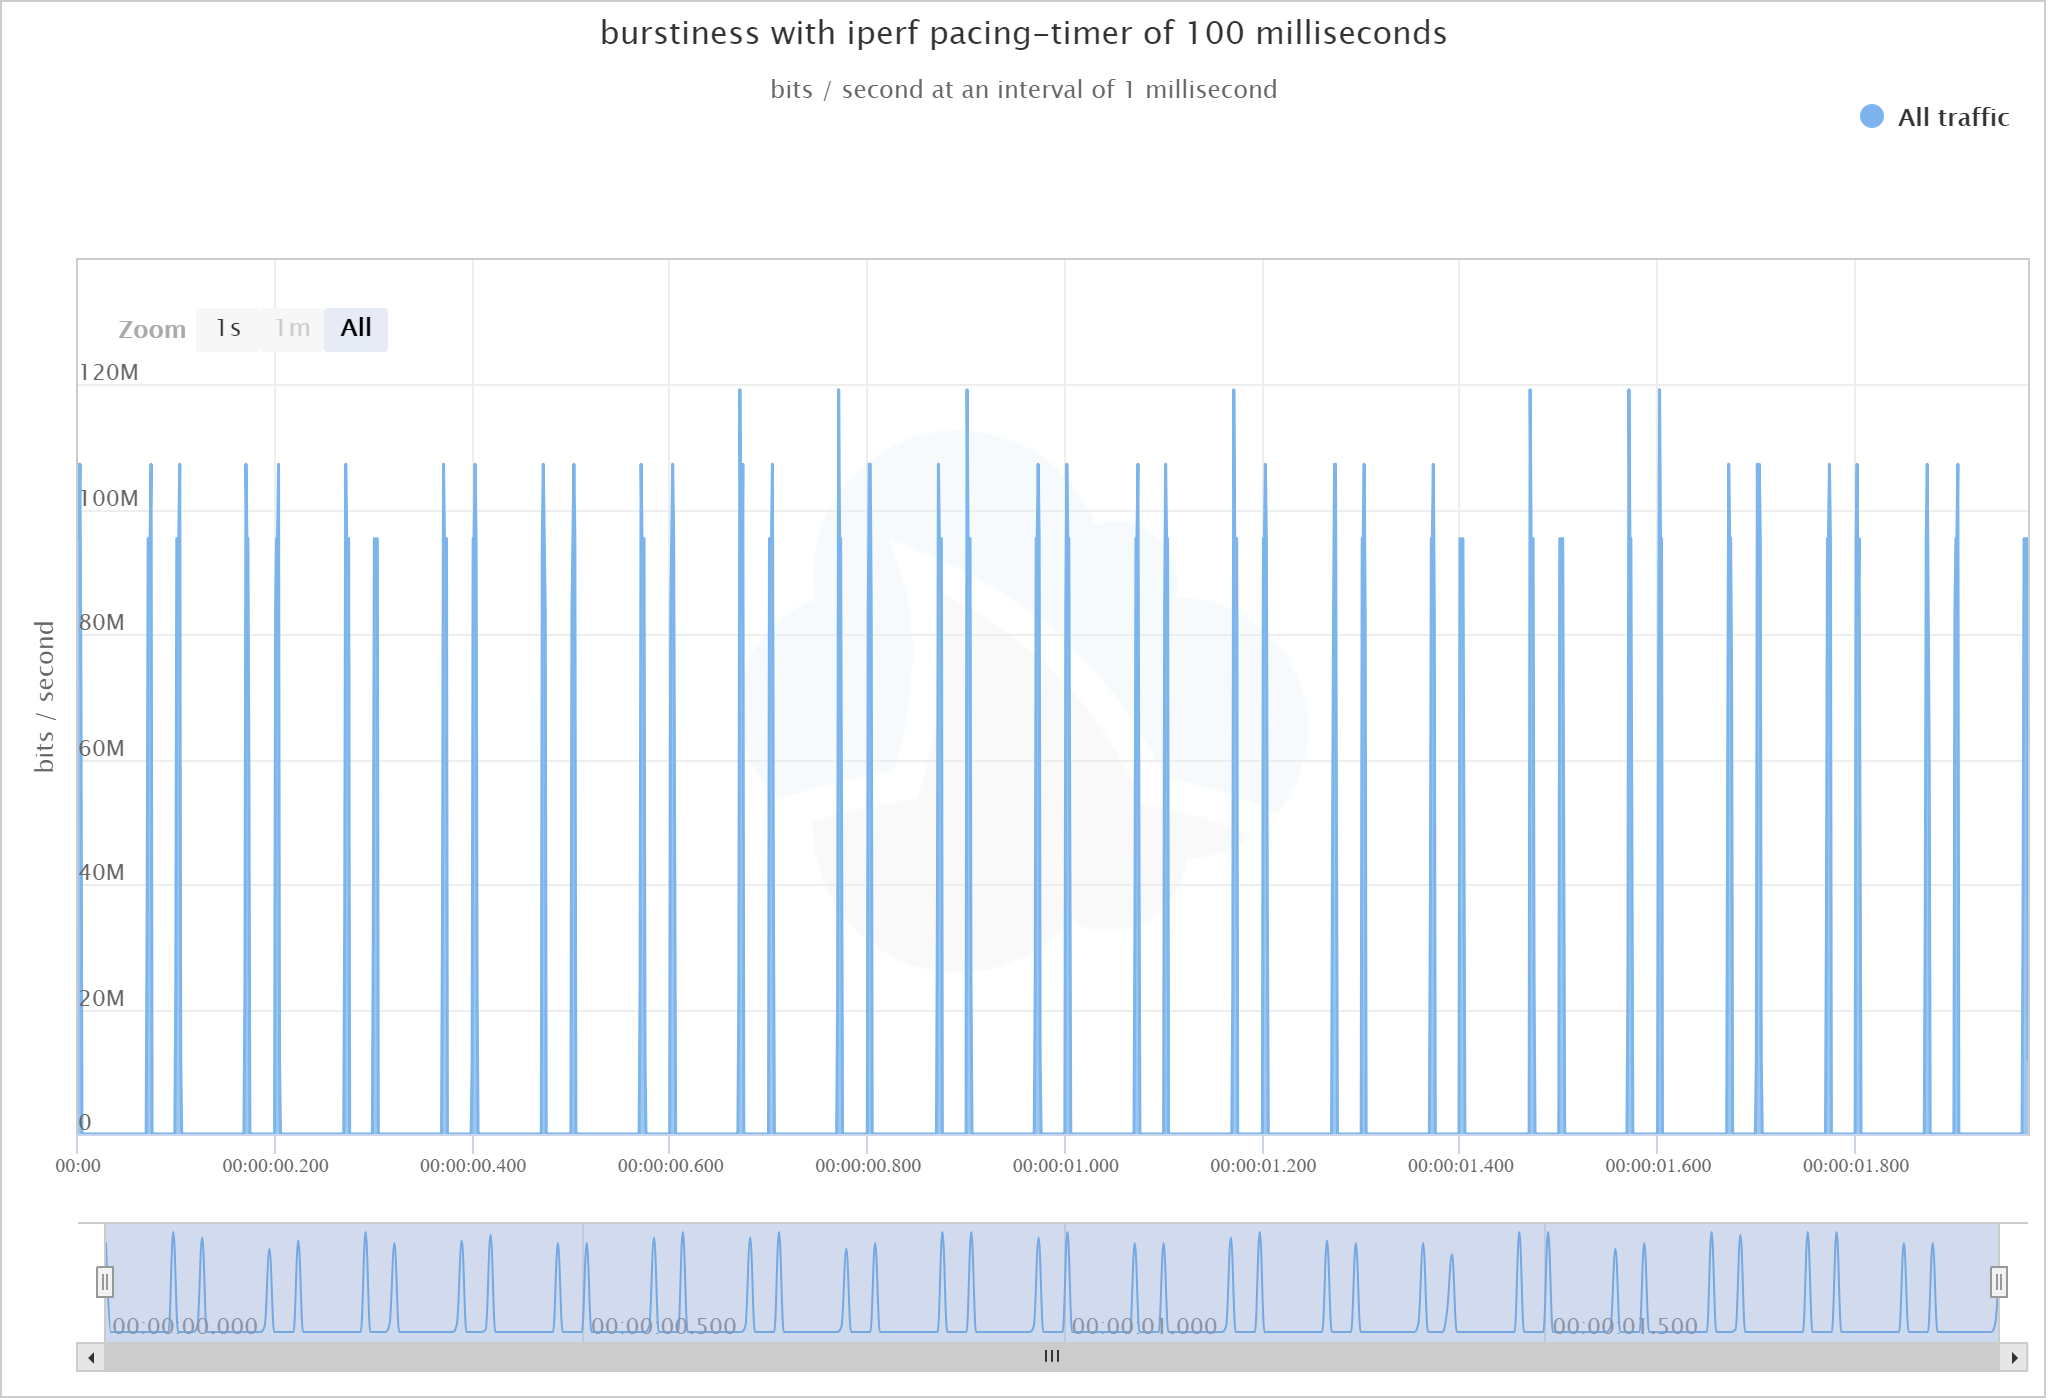
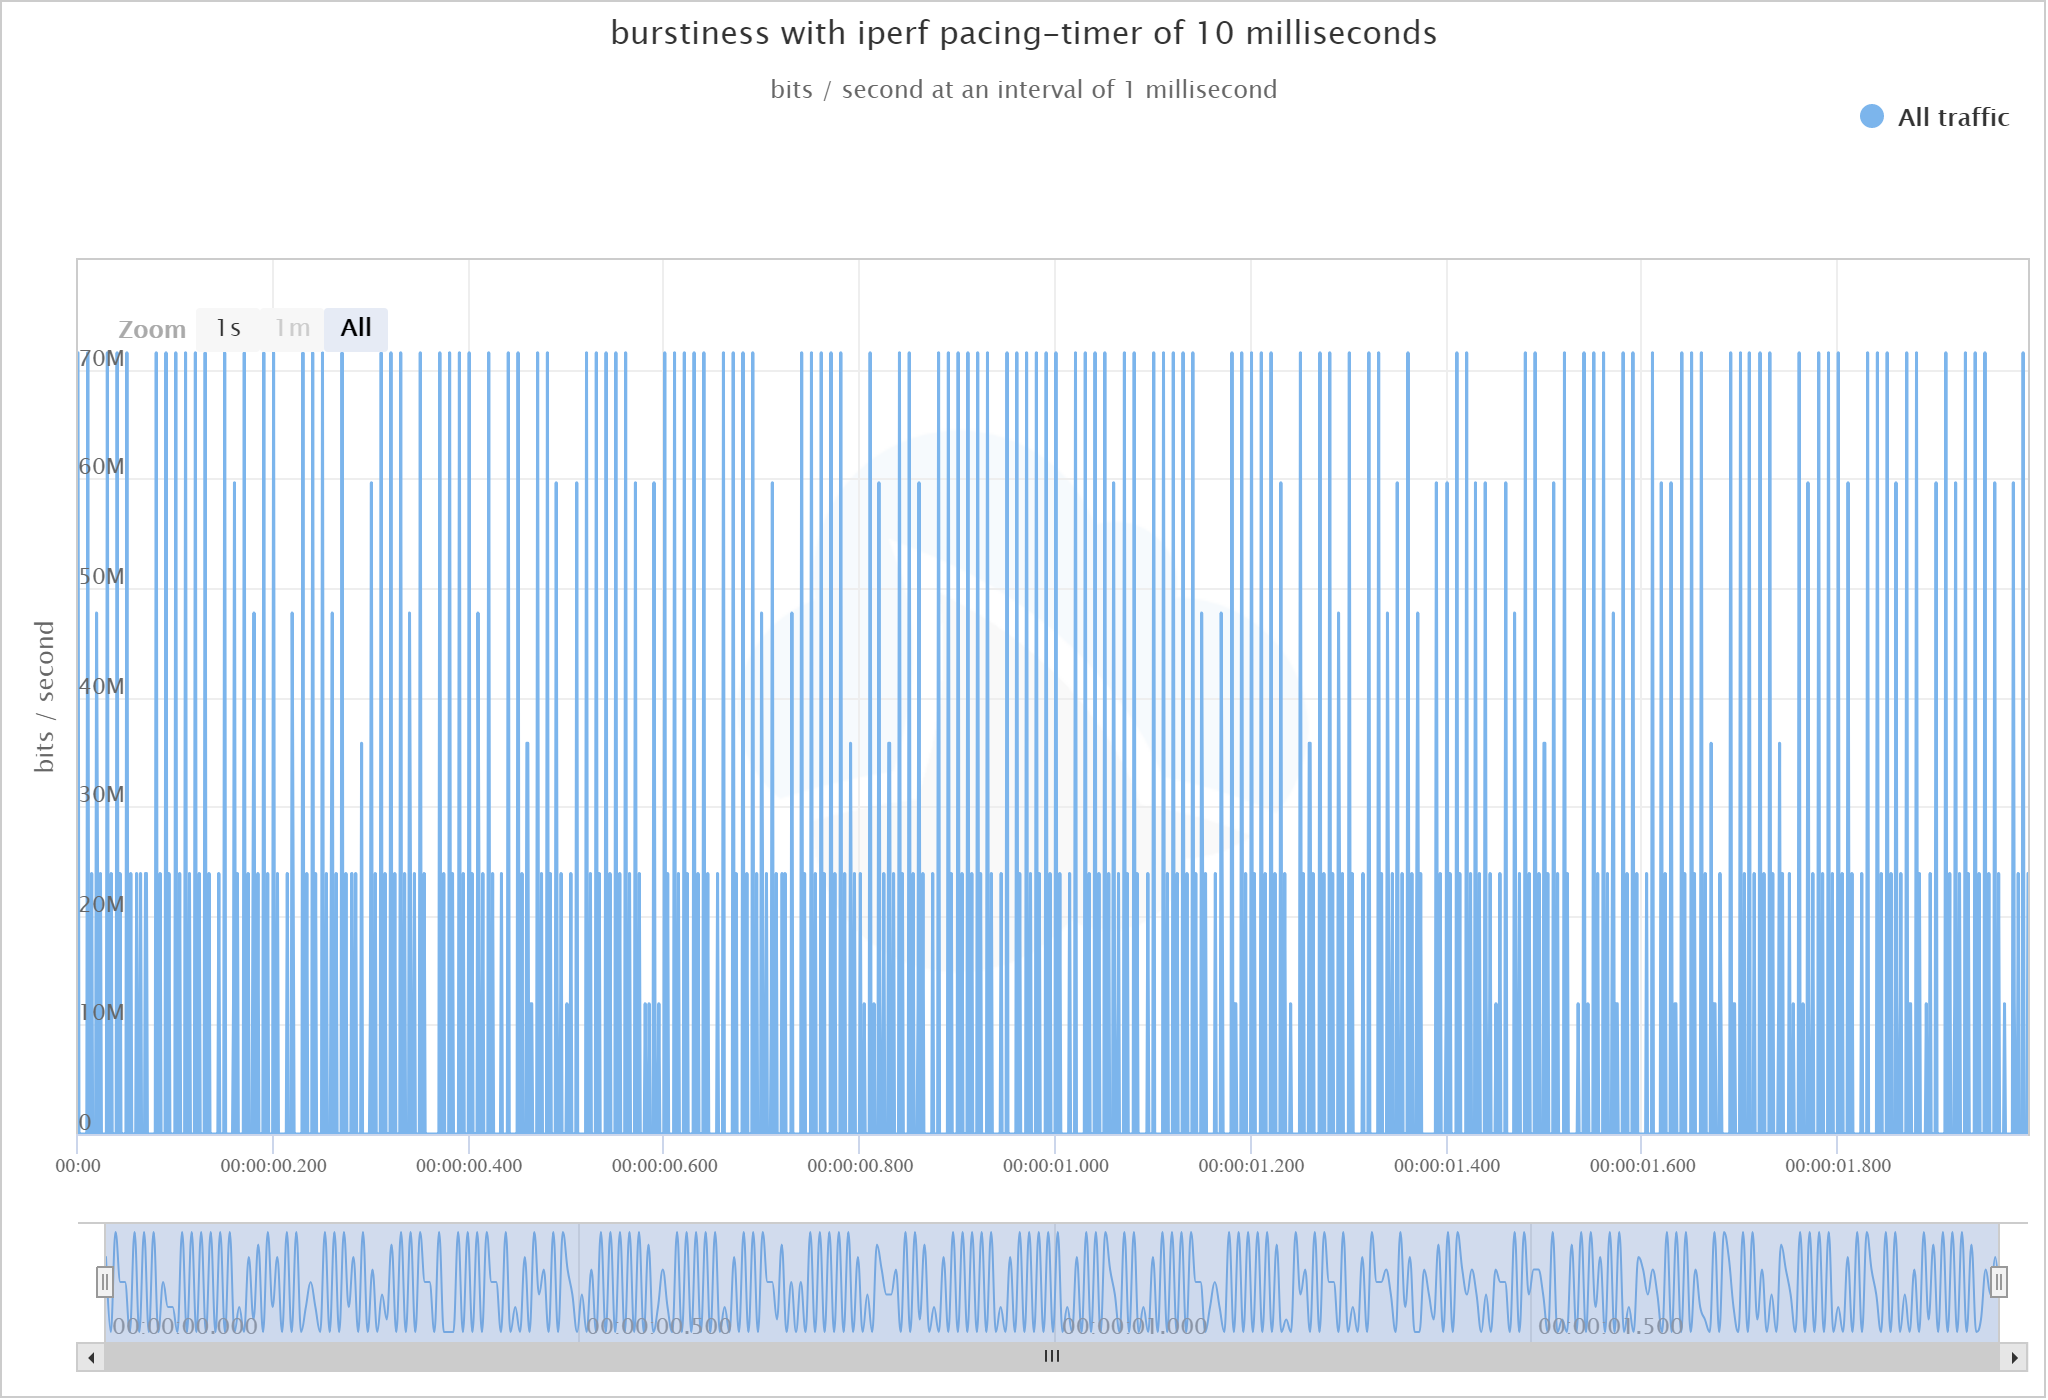
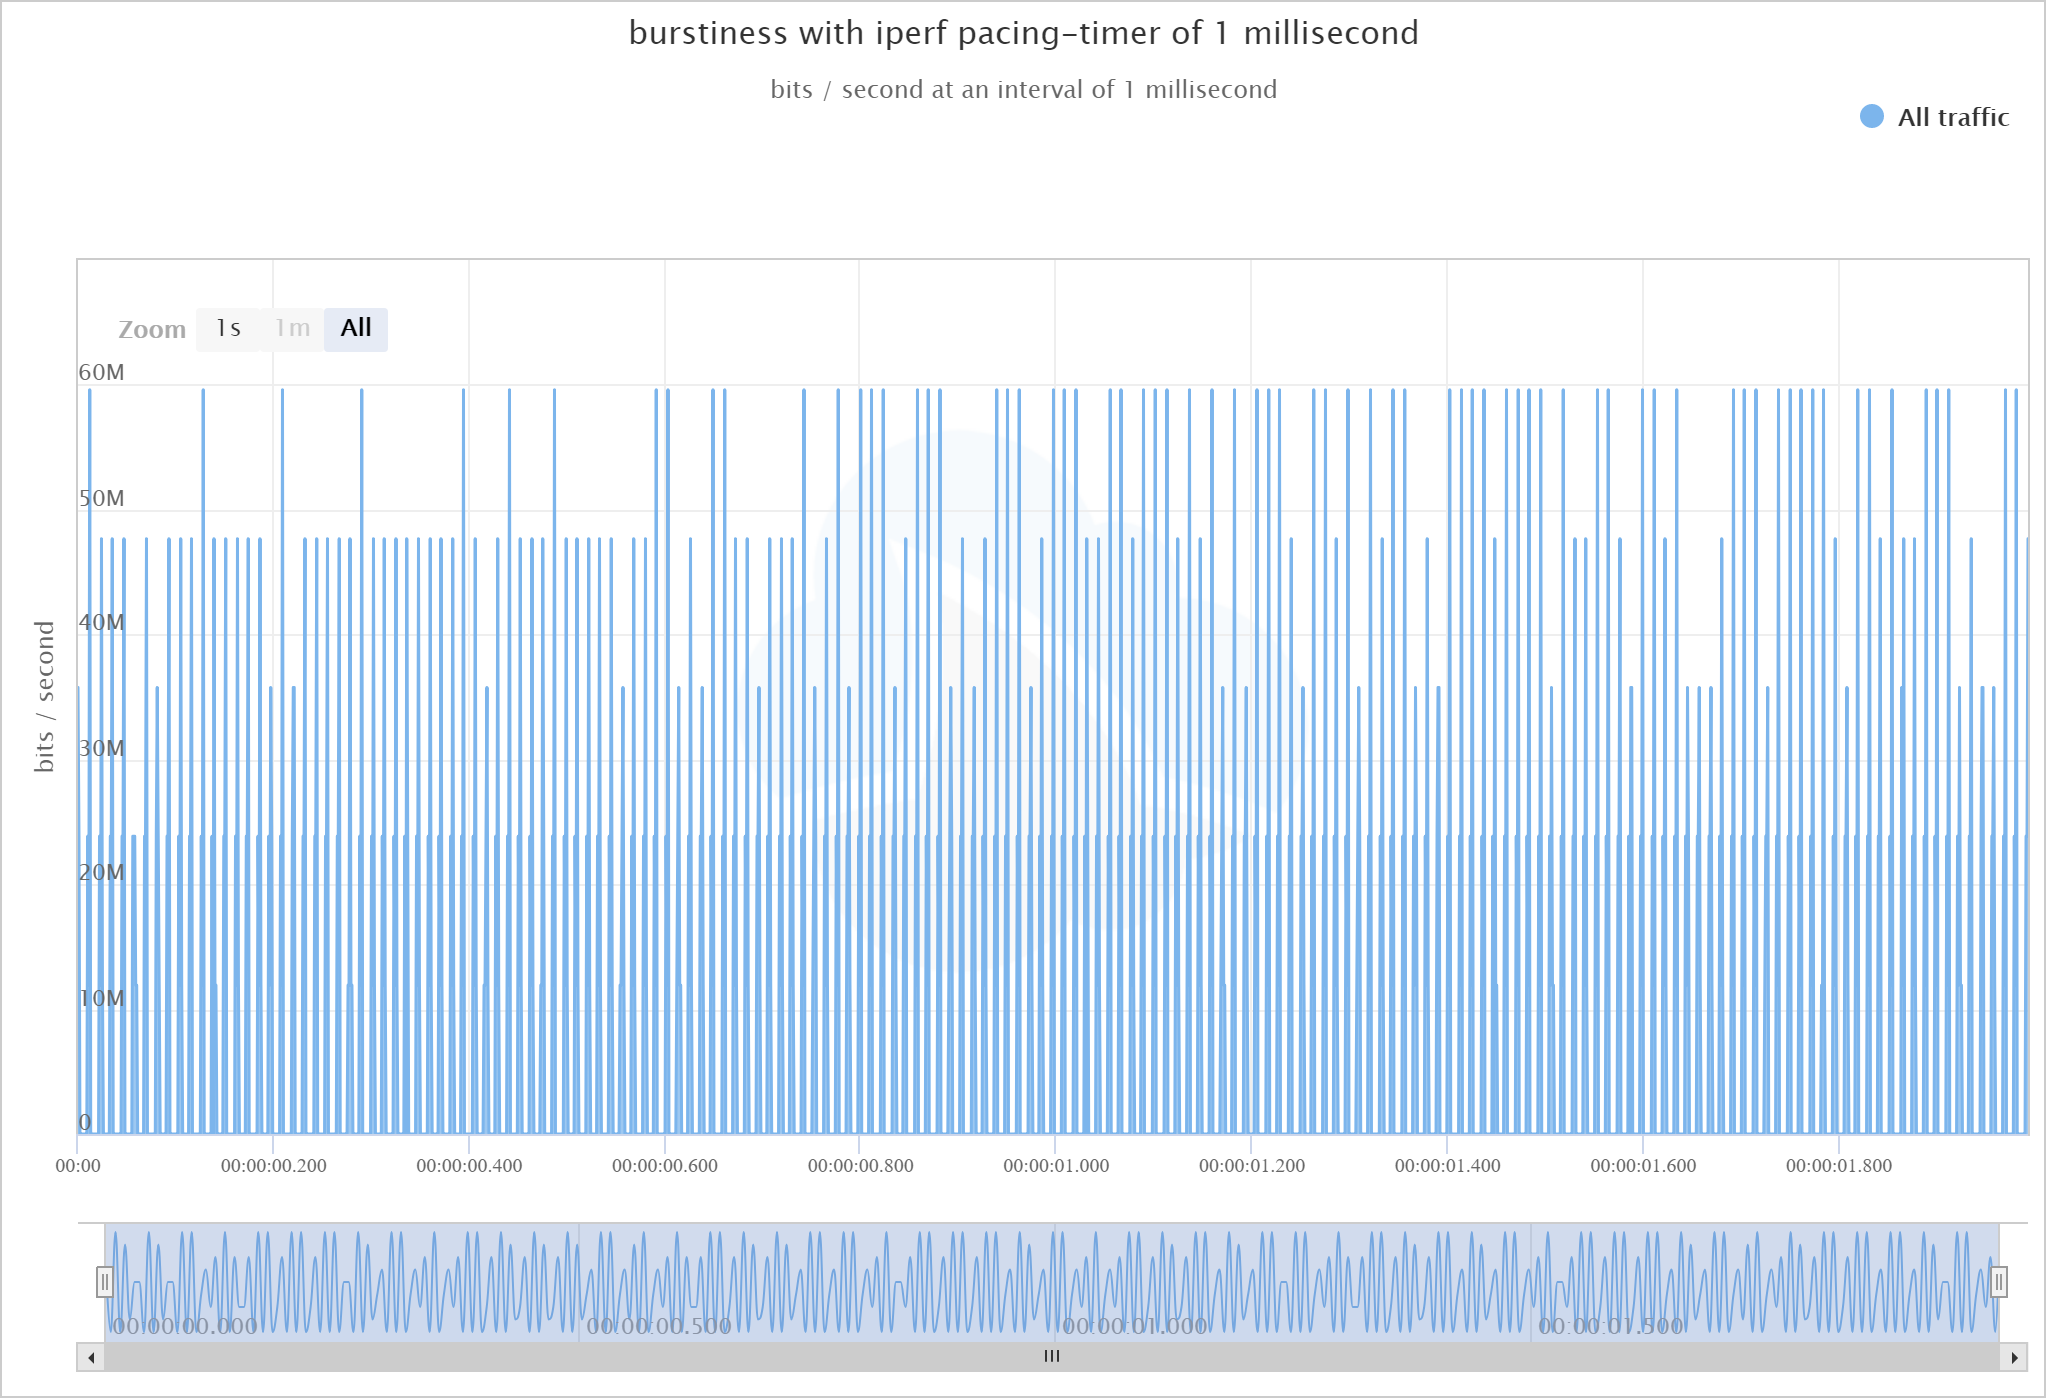
We can use this flag to demonstrate the effects of pacing on the “burstiness” of the traffic that iPerf sends as part of its performance tests. Here’s a set of iPerf tests that we ran with different pacing options. These captures were taken with the iPerf client and server on different links of a 100Mbps switch, with the bitrate set to 10 Mbps. Pay attention to the difference in each capture’s “burstiness”.
Note: We took our captures before going through the switch (i.e. from a tap on the iPerf client side), which is an important note in our next post about microburst effects on network equipment.
1 second pacing-timer
Command:
iPerf3 -c -u -b 10M --pacing-timer 1000000

100 millisecond pacing-timer
Command:
iPerf3 -c -u -b 10M --pacing-timer 100000

10 millisecond pacing-timer
Command:
iPerf3 -c -u -b 10M --pacing-timer 10000

1ms millisecond pacing-timer
Command:
iPerf3 -c -u -b 10M --pacing-timer 1000

About the pacing option
The --pacing option was added in iPerf 3.2 to allow the rate check frequency to be configurable. Prior to this, the default check time was 100ms, causing bursty UDP traffic and a source of much confusion. You can read about this bug and the addition of the pacing flag here.
Conclusions
You’ll notice that as we decrease the pacing timer, the “burstiness” of the throughput also decreases. This makes sense: if you send all your data for the entire second in the first millisecond, and then don’t send data for the rest of the second… you have a burst!
It’s also useful to note here that we’re able to view data in this way by setting the CloudShark graph interval to 1ms. We discuss this in another post about microbursts.
Using these command options with iPerf can help you test the effects of bursts on your network. Now get out there and test your switches! We’ll follow up with some interesting tests we did in our own labs using different switches and topologies.
Want articles like this delivered right to your inbox?
No spam, just good networking