Articles
Analyzing your device's network behavior during testing
4 min read
A growing number of consumer network devices have become dependent on live network resources in order to come online and function correctly. These resources include cloud management systems, “sanity check” connections to sites like Facebook, Google, etc., and third-party applications that provide security or parental control services.
CDRouter ICS allows devices under test using the CDRouter automation platform to freely connect to and receive traffic from such sources while feature, scaling, and performance testing are being done in parallel. This is extremely useful when running tests in a closed-loop, simulated network while still allowing the DUT to connect to the resources it requires. But it also presents another opportunity - looking at the application traffic itself to analyze and troubleshoot these services.
Using packet captures from CDRouter ICS
Viewing the application traffic capture in CDRouter
ICS automatically creates packet capture files of the test traffic sourced by CDRouter (on the LAN and WAN), plus an additional capture file of the traffic that passes through the network connection set up by ICS for your device’s application traffic.
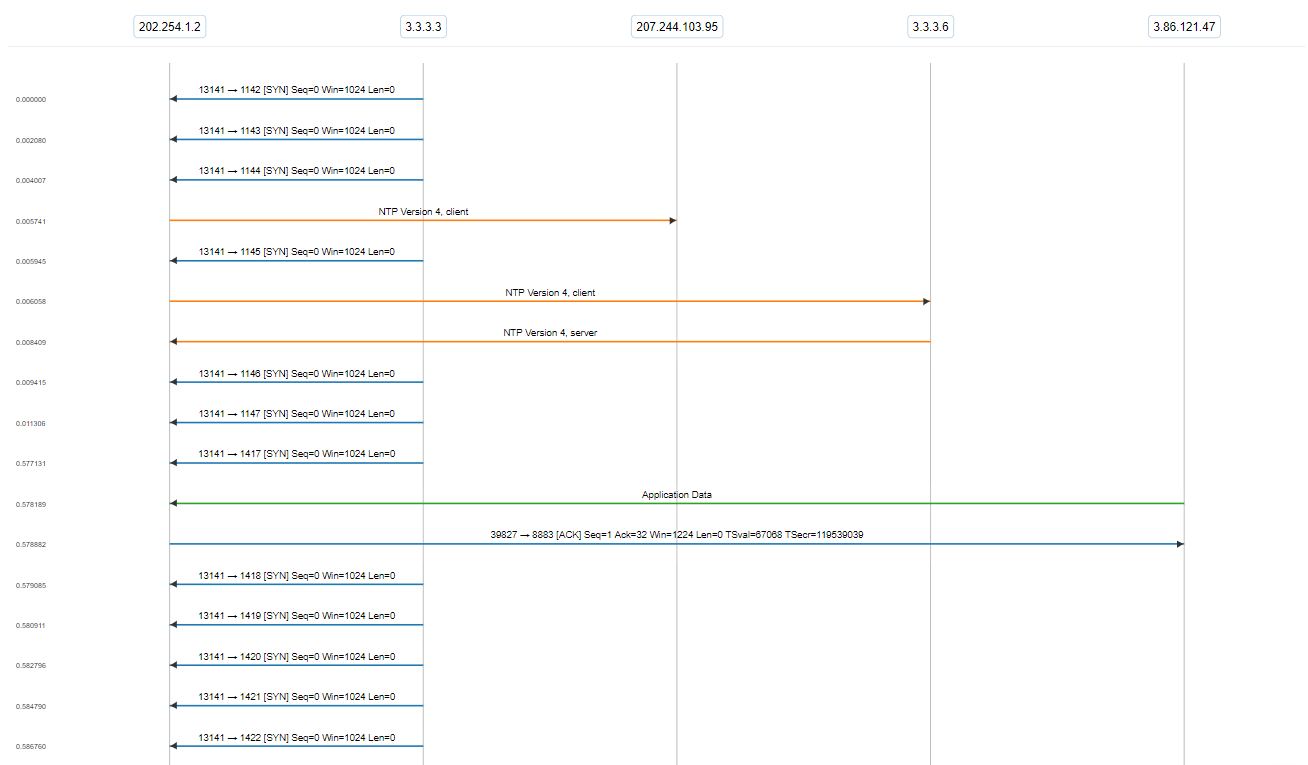
For example, look at this capture which we’ve hosted on CloudShark. It’s a small snippet of our cdrouter_firewall_100.tcl test case, in which CDRouter attempts to probe the DUT’s firewall. In the following ladder diagram, you can see the traffic between CDRouter’s simulated WAN termination (at 3.3.3.3) and the DUT (located at 202.254.1.2). You can also see the DUT communicating with an external NTP server (207.244.103.95), along with CDRouter’s simulated NTP server (at 3.3.3.6), and receiving some encrypted application data over a secure MQTT connection (3.86.121.47).

Use cases for ICS capture analysis
Having the packet capture data available after testing presents a number of opportunities for checking the robustness of not just your device, but the applications it requires. Here are some examples.
Connectivity to management systems
Your device may require a connection to a cloud-based management service in order for users to manage their devices. If there’s an issue with the device coming online, you can use ICS’s packet captures to look for the source of these issues (for example, during CDRouter’s startup test), or keep a record of these captures for developers to debug and improve the management application.
Users looking to test TR-069 devices with an existing ACS or specific provider can use CDRouter ICS to capture the CWMP communication for debugging purposes, too. ACS onboarding processes that require the use of Connection Request can be used if system supports XMPP Connection Request or the use of STUN to cross NAT boundaries - and the resulting capture files will help analyze these functions as well.
“Sanity check” processes for devices coming online
If your device is configured to immediately contact external sites in order to validate that it is online, recording a packet capture of this process can help when analyzing that the device does so in a timely manner and adjusts for when the problem is with the external sites themselves rather than a problem with WAN connectivity. You can also use the captures to witness the entire process; from DNS lookup to HTTP response.
Security of cloud-based services
Modern “smart” gateways can contain security applications or parental control systems that need to connect to external sources. These services may be included in the gateway’s software or installed as a third-party application connecting to third-party web services. In addition to debugging the functionality of these applications, it’s also important to check that these services are secured and do not transmit sensitive user data over an unsecured connection. Analyzing the ICS packet captures can find issues like these before devices are deployed in a network or purchased by end-users.
Analyzing ICS captures in CloudShark
CDRouter’s packet capture viewer is based on CloudShark’s CS Traceframe, but you can also use CloudShark directly for more advanced analysis. In particular, you can analyze any encrypted data that might be present by applying the necessary encryption keys. You can read more about how to do this in CloudShark here. This is a great way to be able to troubleshoot your device’s reliance on outside resources while leaving them in a secure, production ready state.